
Using Infographics to Deliver Your Message

Why have Infographics gained so much popularity over the last few years? The answer is because they visually represent a great deal of data in a way that is easy for us to understand and remember. The Internet and social media make it easy to share the Infographics and increase your reach. Businesses can relay many different types of statistics or promote their brand, products, or services using Infographics.
We previously discussed Infographics in the article on Content Marketing With Infographics. A quick check of Google Trends will show you how the interest in Infographics has continued to increase dramatically over the years. This indicates that Infographics are here to stay and they are a staple for modern-day communication. This article will explore why Infographics are an excellent choice for aggregating and presenting your data to your audience and you will learn tips on how to create Infographics serve your purpose best.
Advantages of Infographics over Text Alone
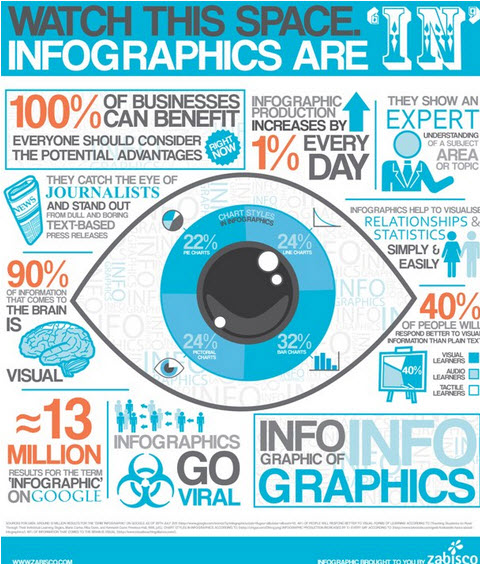
Photo Credit: JeffBullas.com
The blend of writing analysis and imagery that make up Infographics is more appealing to us as we read and consume data because most of our brain’s processing is visual. As we attempt to make sense of all of the content we see every day, visuals are processed faster and are also retained for longer than just text alone. Infographics are easy to scan and their concise nature appeals to our short attention spans. At the same time, an Infographic can combat information overload.
Benefits of Infographics
- Increase in memory retention versus text only.
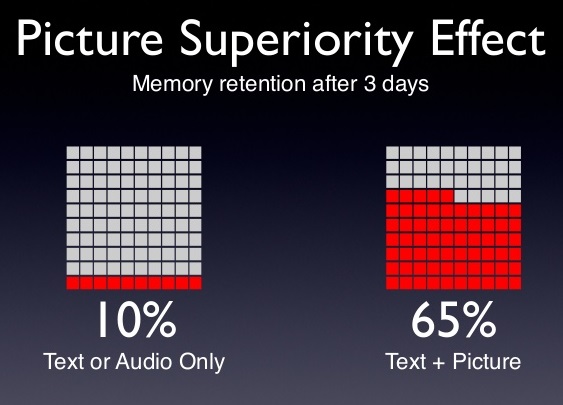
Photo Credit: European Journal of Cognitive Psychology
- Attract readers’ attention because the human brain is geared toward visual processing.
- Shareable with viral capability that can increase traffic to your website and increase branding.
- Promote your brand or product.
- Exhibit your expertise and improve your credibility.
Different Ways to Use Infographics
Infographics can be used in a number of different ways. The next time that you are presenting data or statistics, consider how much more more successful you will be with an Infographic representation of that data. Infographics can show poll results, explain how something works, present your product or service, compare and contrast a topic, or they can simplify a more complicated concept. Statistician Edward Tufte is quoted as saying, “Of all methods for analyzing and communicating statistical information, well-designed data graphics are usually the simplest and at the same time the most powerful.” Remember that using humor, cleverness, and interesting visuals will help your information stand out and be remembered.
Tools for Creating Awesome Infographics for Your Business
How can you get started on developing Infographics that catch and hold the attention of your target audience? If you have some working knowledge of graphics and graphic design, you can use an image editor like Photoshop or a similar product. For Infographics, you can also use vector graphic tools to create geometrical shapes to use in your Infographics. However, even if you do not have design skills, there many tools available (some of which are free) that allow you to create visual design elements. Here are five tools to help you on your way to Infographics:
-
Infogr.am: This is an online site that helps you create an Infographic based on the information and data you enter. It will illustrate images for you and then allows you to edit it and post it online with social media share buttons.
-
Gliffy.com: Free online tool that creates organizational charts, flow charts, diagrams, and more.
-
TheNountProject.com: This is a website that gives you images to match nouns. It has a search feature that returns many different image results that you can use to help signify or represent data in your Infographic.
-
Chartle.net: This is another website that allows you to chart the data you input into the online site. It offers you a selection of formatting choices to design the type of chart and use the colors you want.
-
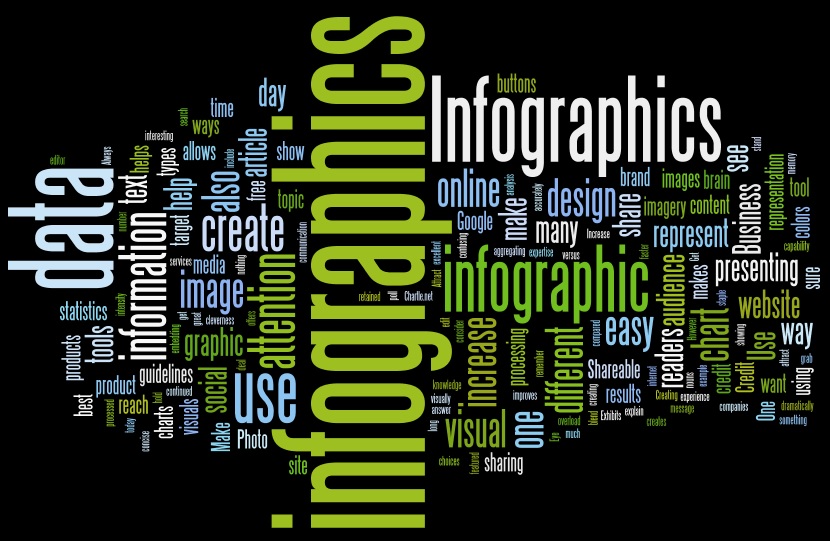
Wordle.net: This is a simple tool to use a word cloud to represent text. It helps readers see a summary of what is important and also makes a nice royalty-free image to use in articles. You can choose the font, colors, and arrangement. For example, here is a Wordle of this article:
Conclusion and Takeaways for Your Business
Using Infographics is one of the best ways to effectively and efficiently communicate information in today’s world of data intensity. The amount of data that an average person views each day is staggering compared to the past. Infographics give companies a way to not only reach a target audience but also to grab their attention and be memorable. Here are five guidelines to follow when creating your own Infographics:
-
Accuracy is Job One: If your visual is showing a statistic, make sure that the graphic representation reflects this accurately. There is nothing worse that presenting a pie chart image that adds up to more than 100%.
-
Show Expertise and Credibility: Always credit where your information comes from.
-
Use Eye-catching Images and Colors: Use colors and a mix of different types of imagery to attract and keep the readers’ attention.
-
Make it Shareable: One of the advantages of Infographics is that they can be shared. Make sharing easy by embedding social share buttons with your Infographic. Also be sure to include guidelines for sharing if you want credit, a link, or if the data are copyrighted.
-
Maintain Focus: Keep your Infographic on topic. If you have more than one message, create multiple Infographics rather than one, long confusing one.
We are pleased to provide you with the insightful comments contained herein. For a complimentary assessment of your online presence, let’s have coffee.
Via LinkedIn Groups
Group: Succeed: Small Business Network, Powered by Staples
Discussion: How Do You Use Infographics In Your Marketing Strategy?
We just started using http://infogr.am and it’s been a cool experience so far. On the basic subscription, you are …
By Brent Lager
Via LinkedIn Groups
Group: Fans of Mashable
Discussion: How Do You Use Infographics In Your Marketing Strategy?
I use Infographics everyday, just because there is no need to explain anything if i am using them. because all the facts. figures are written there only and this makes my job easier.
By AMIT KUMAR SINGH